How Many Calories in a Cinnamon Roll?
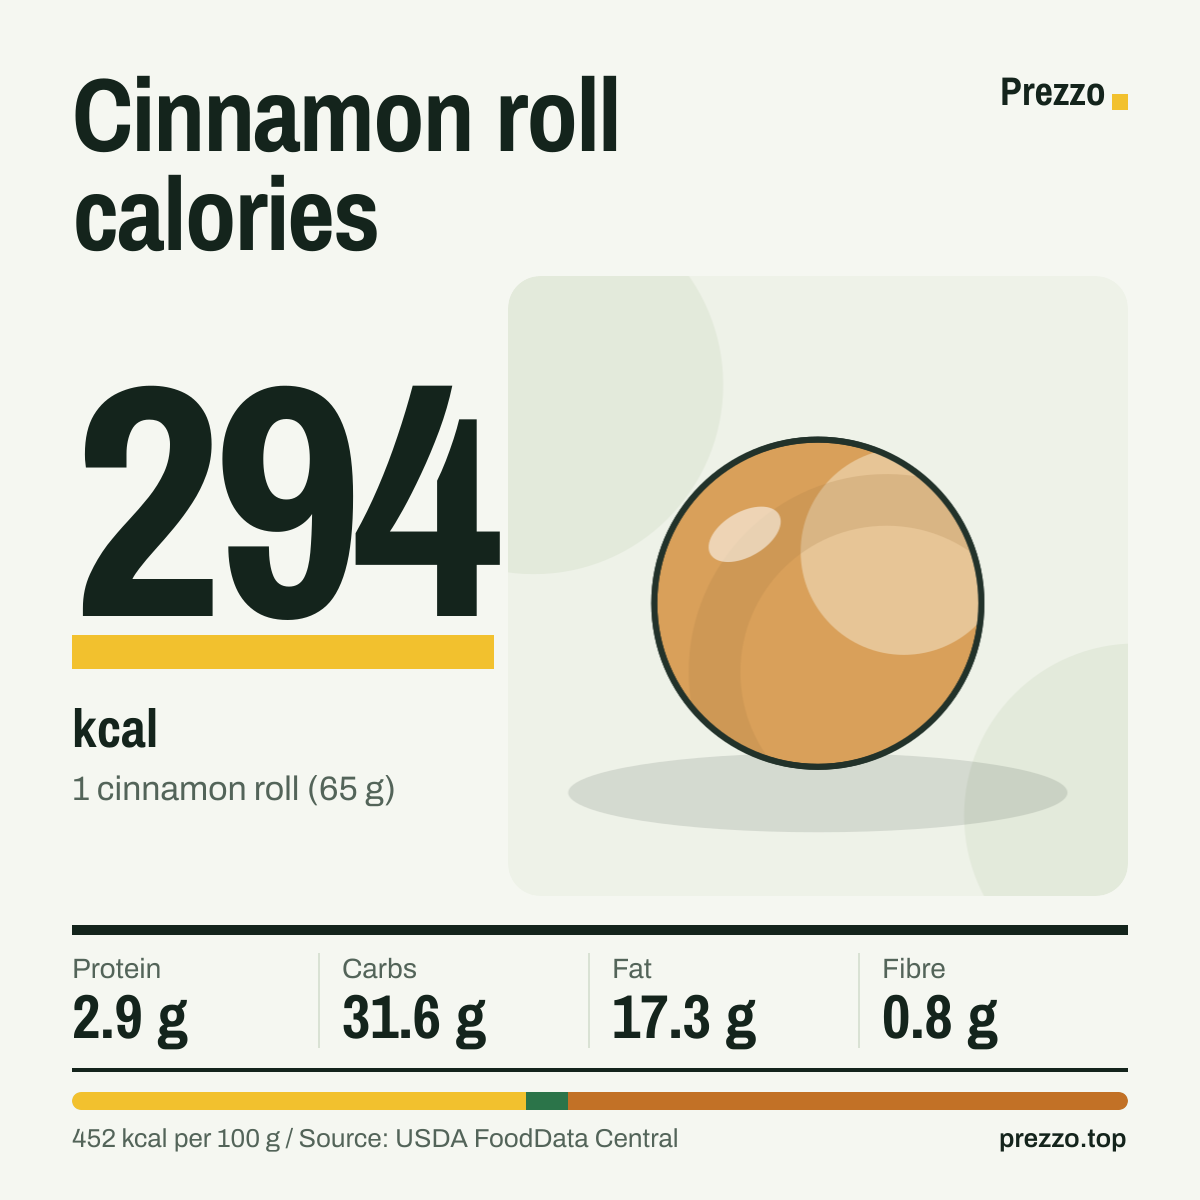
A cinnamon roll (65 g) has 294 kcal. Per 100 g that's 452 kcal, 4.5 g protein, 48.6 g carbs and 25.7 g sugar.
Values for cinnamon roll, from USDA FoodData Central, SR Legacy (FDC 167940).
Choose a portion

Calories by portion
3 common portions of cinnamon roll, from ½ cinnamon roll (147 kcal) to 2 cinnamon rolls (588 kcal). Weights are USDA household measures.
| Portion | Weight | kcal | Protein | Carbs | Fat |
|---|---|---|---|---|---|
| 1 cinnamon roll | 65 g | 294 | 2.9 g | 31.6 g | 17.3 g |
| ½ cinnamon roll | 33 g | 147 | 1.4 g | 15.8 g | 8.6 g |
| 2 cinnamon rolls | 130 g | 588 | 5.8 g | 63.2 g | 34.6 g |
| 100 g | 100 g | 452 | 4.5 g | 48.6 g | 26.6 g |
One cinnamon roll weighs about 65 g.
How long to burn it off
Burning off a cinnamon roll (294 kcal) takes about:
For a 70 kg adult: walking at 5 km/h, cycling at 20 km/h, running at 10 km/h.
Fat supplies 53% of the calories
Of the 452 kcal in 100 g of cinnamon roll, about 43% comes from carbohydrate, 4% from protein and 53% from fat. We count 4 kcal per gram of digestible carbs and protein, 2 per gram of fibre and 9 per gram of fat, the same factors food labels use.
Fat is what makes the number climb: a cinnamon roll holds 17.3 g of fat, 8.2 g of it saturated. Gram for gram, fat carries more than twice the energy of carbohydrate or protein, so small portions of cinnamon roll add up quickly: a cinnamon roll already comes to 294 kcal.
Calcium: 15% of the RI in 1 cinnamon roll
A cinnamon roll (65 g) provides 119 mg of calcium, 15% of the reference intake. It also supplies 9.9 µg of vitamin K (13%) and 0.89 mg of iron (6%). Per 100 g the calcium content is 183 mg.
Figures are for cinnamon roll, as analysed by the USDA.
53% of the carbs are sugar
100 g of cinnamon roll has 48.6 g of carbohydrate: 25.7 g sugar, 1.2 g fibre and 21.7 g of starch and other carbohydrates.
A cinnamon roll (65 g) therefore gives 30.8 g of net carbs (total carbs minus fibre) and 0.8 g of fibre, 3% of the reference intake.
Every 10 g adds 45 calories
Cinnamon roll has 4.5 calories per gram, so the portion decides the total. ½ cinnamon roll (33 g) comes to 147 kcal, while 2 cinnamon rolls (130 g) reaches 588 kcal.
If you weigh your food, 100 calories of cinnamon roll is about 22 g. A cinnamon roll (65 g), the portion most people look up, has 294 kcal.
48% of the fat is saturated
100 g of cinnamon roll has 26.6 g of fat, of which 12.6 g is saturated (48%). A cinnamon roll (65 g) gives 17.3 g of fat and 8.2 g saturated, 41% of the reference intake for saturated fat.
Fat accounts for 53% of the calories, and the same portion contains 3.3 mg of cholesterol.
Compared with similar foods
Cinnamon roll next to similar snacks and desserts, per 100 g.
| Food | kcal | Protein | Carbs | Fat |
|---|---|---|---|---|
| Cinnamon roll | 452 | 4.5 g | 48.6 g | 26.6 g |
| Madeleine | 451 | 6.5 g | 51.2 g | 25.1 g |
| Bakewell tart | 454 | 6.9 g | 42.3 g | 30.4 g |
| Animal biscuits | 446 | 6.9 g | 74.1 g | 13.8 g |
| Cream crackers | 445 | 8.9 g | 73.6 g | 16.4 g |
| Rich tea biscuit | 444 | 6.4 g | 78.1 g | 15.1 g |
Questions people ask
How many calories are in a cinnamon roll?
A cinnamon roll (65 g) has 294 kcal. 100 g has 452 kcal.
How many calories are in 100 g of cinnamon roll?
100 g of cinnamon roll has 452 kcal, with 4.5 g of protein, 48.6 g of carbohydrate and 26.6 g of fat.
How many carbs are in a cinnamon roll?
A cinnamon roll (65 g) has 31.6 g of carbohydrate, including 0.8 g of fibre, so 30.8 g net carbs. Per 100 g: 48.6 g.
How much sugar is in a cinnamon roll?
A cinnamon roll (65 g) has 16.7 g of sugar. 100 g has 25.7 g.
How much does a cinnamon roll weigh?
About 65 g (edible part), according to USDA household measures.
Is cinnamon roll keto-friendly?
Not really. A cinnamon roll (65 g) has 30.8 g of net carbs, which uses up most of a typical 20–50 g daily keto limit.
Similar foods
Cinnamon roll calories at a glance
Sources and method
Nutrient values: USDA FoodData Central, SR Legacy, FDC 167940, retrieved 2026-11-18. Portion weights: USDA and AUSNUT household measures or standard container sizes. Percentages use the EU/UK reference intakes. Glycemic index: International Tables (Atkinson et al., 2021). How we calculate these numbers