How Many Calories in Bubble Tea?
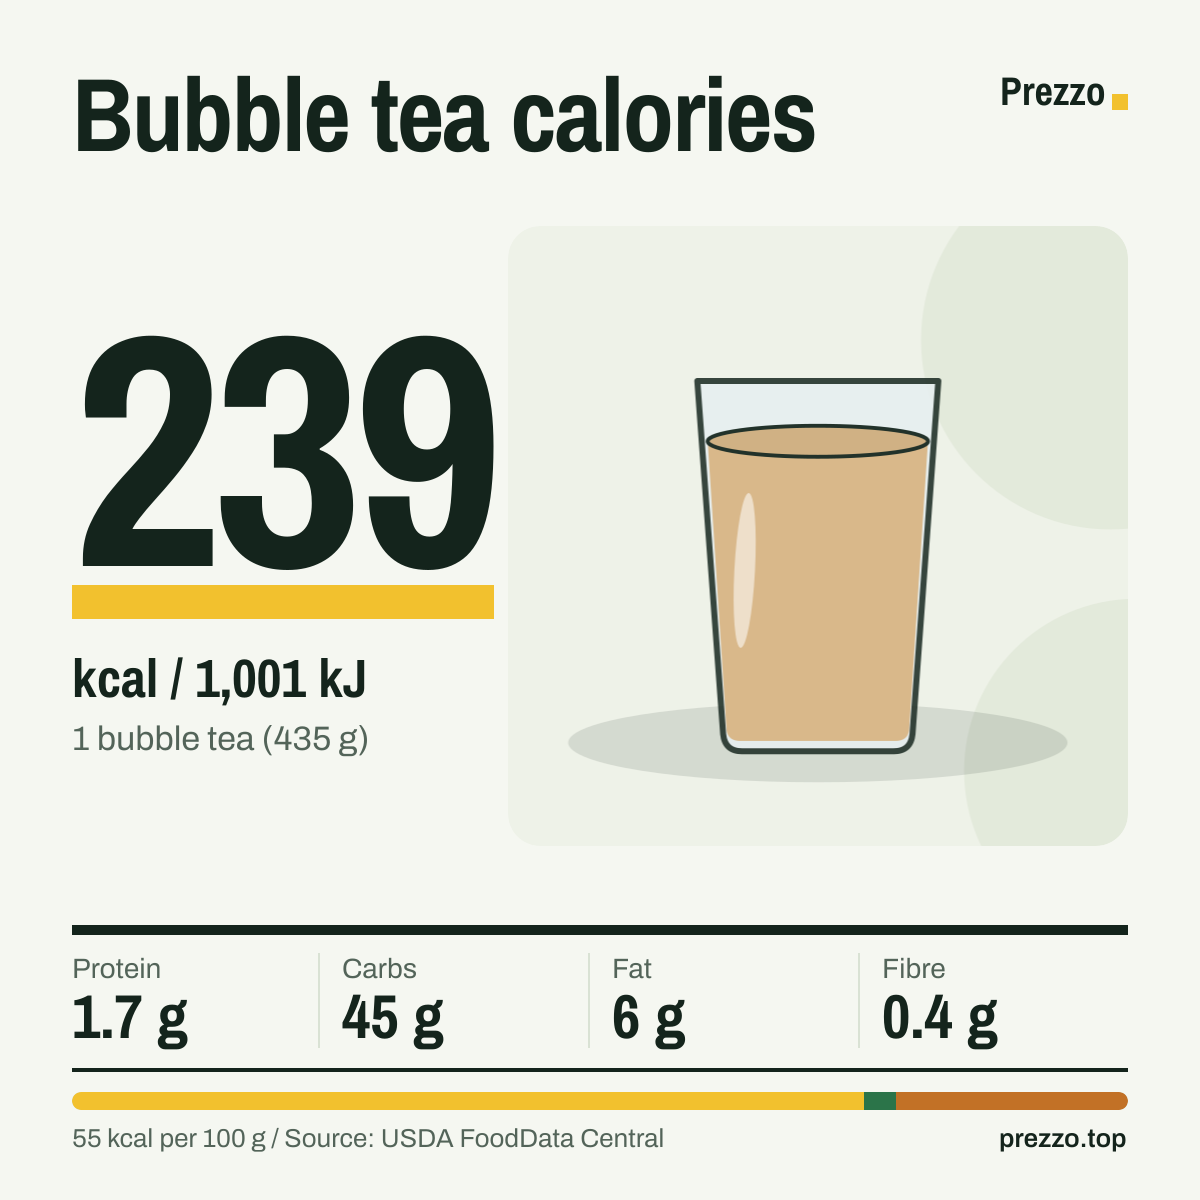
A bubble tea (435 g) has 239 calories (1,001 kJ). Per 100 g that's 55 calories (230 kJ), 0.4 g protein, 10.4 g carbs and 3.5 g sugar.
Values for bubble tea, from USDA FoodData Central, FNDDS (FDC 2710508).
Choose a portion

Calories by portion
3 common portions of bubble tea, from 350 ml (195 kcal) to 500 ml (279 kcal). Weights are USDA household measures.
| Portion | Weight | Calories | kJ | Protein | Carbs | Fat |
|---|---|---|---|---|---|---|
| 1 bubble tea | 435 g | 239 | 1,001 | 1.7 g | 45 g | 6 g |
| 500 ml | 507 g | 279 | 1,167 | 2 g | 52.5 g | 7 g |
| 350 ml | 355 g | 195 | 817 | 1.4 g | 36.7 g | 4.9 g |
| 100 g | 100 g | 55 | 230 | 0.4 g | 10.4 g | 1.4 g |
How long to burn it off
Burning off a bubble tea (239 kcal) takes about:
For a 70 kg adult: walking at 5 km/h, cycling at 20 km/h, running at 10 km/h.
Carbs supply 75% of the calories
Of the 55 calories (230 kJ) in 100 g of bubble tea, about 75% comes from carbohydrate, 3% from protein and 22% from fat. We count 4 kcal per gram of digestible carbs and protein, 2 per gram of fibre and 9 per gram of fat, the same factors food labels use.
That makes bubble tea a carbohydrate food first: a bubble tea carries 45 g of carbohydrate, 15.2 g of it sugar. Protein (1.7 g) and fat (6 g) barely move the total of 239 calories (1,001 kJ).
15.2 g of sugar and 0.4 g of fibre per bubble tea
100 g of bubble tea has 10.4 g of carbohydrate: 3.5 g sugar, 0.1 g fibre and 6.8 g of starch and other carbohydrates.
A bubble tea (435 g) therefore gives 44.6 g of net carbs (total carbs minus fibre) and 0.4 g of fibre, 2% of the reference intake.
Every 10 g adds 5.5 calories
Bubble tea has 0.6 calories per gram, so the portion decides the total. 350 ml (355 g) comes to 195 calories (817 kJ), while 500 ml (507 g) reaches 279 calories (1,167 kJ).
If you weigh your food, 100 calories of bubble tea is about 182 g. A bubble tea (435 g), the portion most people look up, has 239 calories (1,001 kJ).
Practically sodium-free: 9 mg per 100 g
A bubble tea (435 g) has 39 mg of sodium and 74 mg of potassium. Potassium outweighs sodium by roughly 2 to 1, the opposite of most processed foods.
Salt only becomes a factor if you add it or eat bubble tea in a salted dish.
About average in calories for drinks
At 55 calories (230 kJ) per 100 g, bubble tea ranks 33 of 60 drinks on this site, counted from the lowest. The group median is 54 calories (226 kJ) per 100 g; the lowest is black coffee (1) and the highest Irish cream liqueur (305).
A bubble tea (435 g) is 12% of a 2,000-calorie reference day.
Compared with similar foods
Bubble tea next to similar drinks, per 100 g.
| Food | Calories | Protein | Carbs | Fat |
|---|---|---|---|---|
| Bubble tea | 55 | 0.4 g | 10.4 g | 1.4 g |
| Pomegranate juice | 54 | 0.2 g | 13.1 g | 0.3 g |
| Cranberry juice drink | 54 | 0 g | 13.5 g | 0.1 g |
| Pineapple juice | 53 | 0.4 g | 12.9 g | 0.1 g |
| Grape juice | 60 | 0.4 g | 14.8 g | 0.1 g |
| Orange juice | 49 | 0.7 g | 11.5 g | 0.1 g |
Questions people ask
How many calories are in a bubble tea?
A bubble tea (435 g) has 239 calories (1,001 kJ). 100 g has 55 calories (230 kJ).
How many calories are in 100 g of bubble tea?
100 g of bubble tea has 55 calories (230 kJ), with 0.4 g of protein, 10.4 g of carbohydrate and 1.4 g of fat.
How much sugar is in bubble tea?
A bubble tea (435 g) has 15.2 g of sugar. 100 g has 3.5 g.
How many carbs are in bubble tea?
A bubble tea (435 g) has 45 g of carbohydrate, including 0.4 g of fibre, so 44.6 g net carbs. Per 100 g: 10.4 g.
Is bubble tea keto-friendly?
Not really. A bubble tea (435 g) has 44.6 g of net carbs, which uses up most of a typical 20–50 g daily keto limit.
How much fat is in bubble tea?
A bubble tea (435 g) has 6 g of fat, 3.7 g of it saturated. Per 100 g: 1.4 g.
Similar foods
Bubble tea calories at a glance
Sources and method
Nutrient values: USDA FoodData Central, FNDDS, FDC 2710508, retrieved 2026-11-18. Portion weights: USDA and AUSNUT household measures or standard container sizes. Percentages use the EU/UK reference intakes. Glycemic index: International Tables (Atkinson et al., 2021). How we calculate these numbers