How Many Calories in a Focaccia?
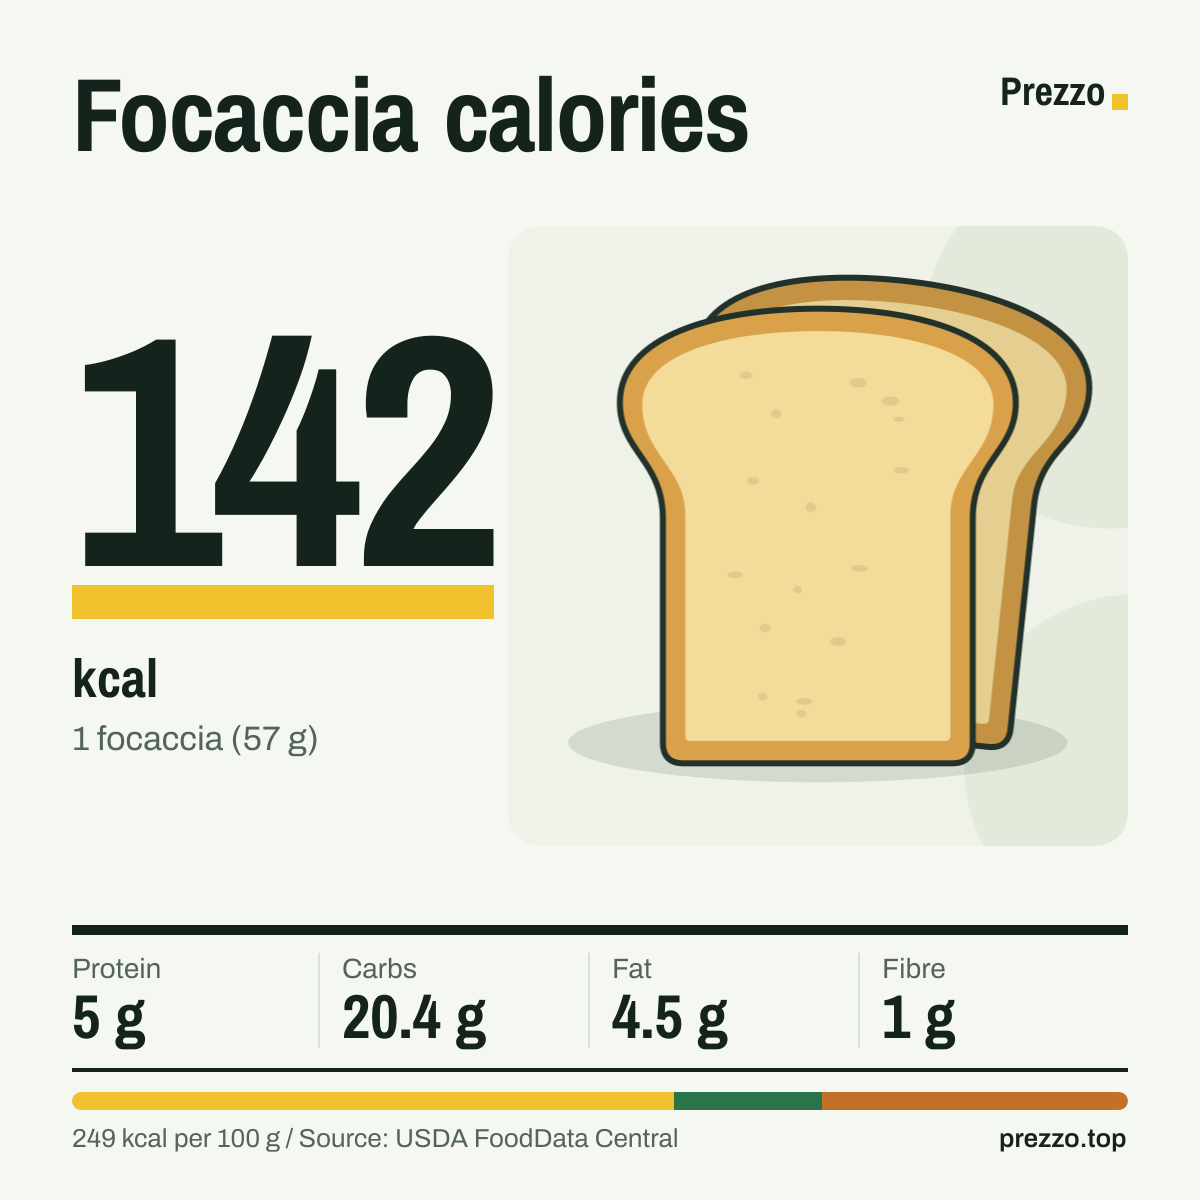
A focaccia (57 g) has 142 kcal. Per 100 g that's 249 kcal, 8.8 g protein, 35.8 g carbs and 1.8 g sugar.
Values for baked focaccia, from USDA FoodData Central, SR Legacy (FDC 167945).
Choose a portion
Calories by portion
3 common portions of focaccia, from ½ focaccia (71 kcal) to 2 focaccias (284 kcal). Weights are USDA household measures.
| Portion | Weight | kcal | Protein | Carbs | Fat |
|---|---|---|---|---|---|
| 1 focaccia | 57 g | 142 | 5 g | 20.4 g | 4.5 g |
| ½ focaccia | 29 g | 71 | 2.5 g | 10.2 g | 2.2 g |
| 2 focaccias | 114 g | 284 | 10 g | 40.8 g | 9 g |
| 100 g | 100 g | 249 | 8.8 g | 35.8 g | 7.9 g |
One focaccia weighs about 57 g.
How long to burn it off
Burning off a focaccia (142 kcal) takes about:
For a 70 kg adult: walking at 5 km/h, cycling at 20 km/h, running at 10 km/h.
Carbs supply 57% of the calories
Of the 249 kcal in 100 g of focaccia, about 57% comes from carbohydrate, 14% from protein and 29% from fat. We count 4 kcal per gram of digestible carbs and protein, 2 per gram of fibre and 9 per gram of fat, the same factors food labels use.
That makes focaccia a carbohydrate food first: a focaccia carries 20.4 g of carbohydrate, 1 g of it sugar. Protein (5 g) and fat (4.5 g) barely move the total of 142 kcal.
Iron: 13% of the RI in 1 focaccia
A focaccia (57 g) provides 1.8 mg of iron, 13% of the reference intake. It also supplies 0.76 mg of zinc (8%) and 0.81 mg of vitamin E (7%). Per 100 g the iron content is 3.2 mg.
Figures are for baked focaccia, as analysed by the USDA.
5 g of protein in 1 focaccia
A focaccia (57 g) provides 5 g of protein, 10% of the reference intake for protein. Per 100 g the figure is 8.8 g. Measured against energy, that is 3.5 g of protein for every 100 calories; among the grains and breads on this site, yeast extract has 23.9 g per 100 g.
Across common portions: 1 focaccia gives 5 g, ½ focaccia gives 2.5 g and 2 focaccias give 10 g.
Almost none of the carbs are sugar
100 g of focaccia has 35.8 g of carbohydrate: 1.8 g sugar, 1.8 g fibre and 32.3 g of starch and other carbohydrates.
A focaccia (57 g) therefore gives 19.4 g of net carbs (total carbs minus fibre) and 1 g of fibre, 4% of the reference intake.
Every 10 g adds 25 calories
Focaccia has 2.5 calories per gram, so the portion decides the total. ½ focaccia (29 g) comes to 71 kcal, while 2 focaccias (114 g) reaches 284 kcal.
If you weigh your food, 100 calories of focaccia is about 40 g. A focaccia (57 g), the portion most people look up, has 142 kcal.
Compared with similar foods
Focaccia next to similar grains and breads, per 100 g.
| Food | kcal | Protein | Carbs | Fat |
|---|---|---|---|---|
| Focaccia | 249 | 8.8 g | 35.8 g | 7.9 g |
| Pumpernickel | 250 | 8.7 g | 47.5 g | 3.1 g |
| Wholemeal bread | 252 | 12.5 g | 42.7 g | 3.5 g |
| Rye bread | 259 | 8.5 g | 48.3 g | 3.3 g |
| Multigrain roll | 263 | 9.6 g | 44.6 g | 6 g |
| Bagel | 264 | 10.6 g | 52.4 g | 1.3 g |
Questions people ask
How many calories are in a focaccia?
A focaccia (57 g) has 142 kcal. 100 g has 249 kcal.
How many calories are in 100 g of focaccia?
100 g of baked focaccia has 249 kcal, with 8.8 g of protein, 35.8 g of carbohydrate and 7.9 g of fat.
Is focaccia good for weight loss?
No single food causes weight loss; your total energy intake over time decides it. At 249 kcal per 100 g, focaccia has a moderate energy density, and a focaccia is 7% of a 2,000-calorie day. This is general information, not medical advice.
How many carbs are in a focaccia?
A focaccia (57 g) has 20.4 g of carbohydrate, including 1 g of fibre, so 19.4 g net carbs. Per 100 g: 35.8 g.
Is focaccia keto-friendly?
Not really. A focaccia (57 g) has 19.4 g of net carbs, which uses up most of a typical 20–50 g daily keto limit.
How much fat is in a focaccia?
A focaccia (57 g) has 4.5 g of fat, 0.5 g of it saturated. Per 100 g: 7.9 g.
Similar foods
Focaccia calories at a glance
Sources and method
Nutrient values: USDA FoodData Central, SR Legacy, FDC 167945, retrieved 2026-11-18. Portion weights: USDA and AUSNUT household measures or standard container sizes. Percentages use the EU/UK reference intakes. Glycemic index: International Tables (Atkinson et al., 2021). How we calculate these numbers