How Many Calories in Squid?
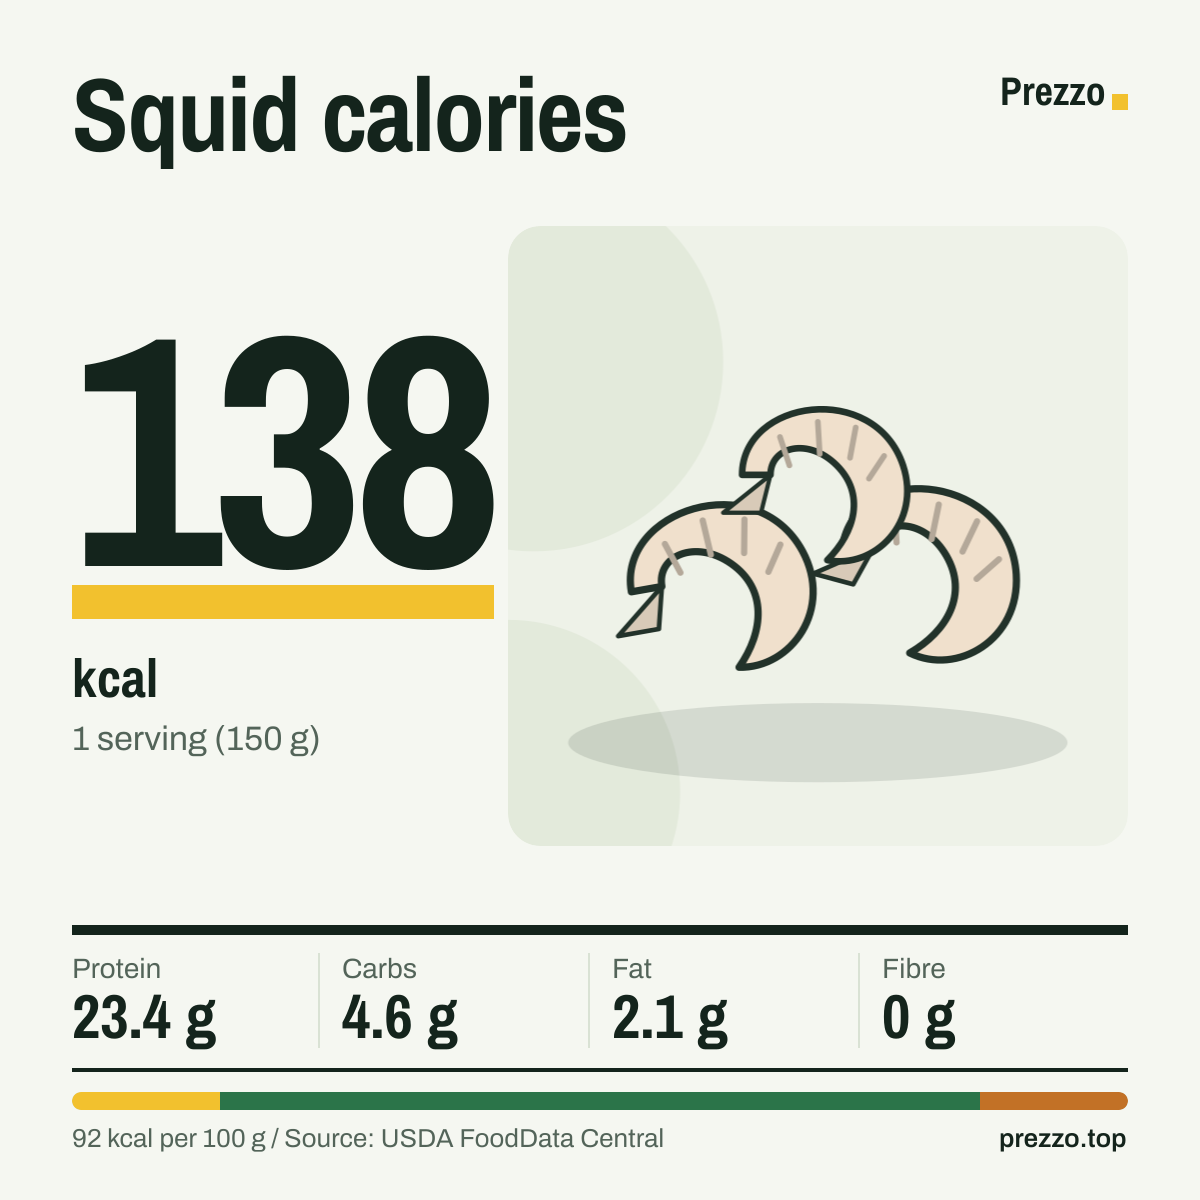
1 serving of squid (150 g) has 138 kcal. Per 100 g that's 92 kcal, 15.6 g protein, 3.1 g carbs and 1.4 g fat.
Values for raw squid, from USDA FoodData Central, SR Legacy (FDC 174223).
Choose a portion

Calories by portion
3 common portions of squid, from 1 small serving (78 kcal) to 1 large serving (230 kcal). Weights are USDA household measures.
| Portion | Weight | kcal | Protein | Carbs | Fat |
|---|---|---|---|---|---|
| 1 serving | 150 g | 138 | 23.4 g | 4.6 g | 2.1 g |
| 1 small serving | 85 g | 78 | 13.2 g | 2.6 g | 1.2 g |
| 1 large serving | 250 g | 230 | 39 g | 7.7 g | 3.5 g |
| 100 g | 100 g | 92 | 15.6 g | 3.1 g | 1.4 g |
Preparation
The same food, prepared 2 ways. Values per 100 g and for 1 serving.
| Preparation | kcal / 100 g | 1 serving | Protein | Carbs | Fat |
|---|---|---|---|---|---|
| Raw squid | 92 | 138 | 15.6 g | 3.1 g | 1.4 g |
| Fried squid | 175 | 263 | 17.9 g | 7.8 g | 7.5 g |
How long to burn it off
Burning off 1 serving of squid (138 kcal) takes about:
For a 70 kg adult: walking at 5 km/h, cycling at 20 km/h, running at 10 km/h.
Protein supplies 72% of the calories
Of the 92 kcal in 100 g of squid, about 14% comes from carbohydrate, 72% from protein and 14% from fat. We count 4 kcal per gram of digestible carbs and protein, 2 per gram of fibre and 9 per gram of fat, the same factors food labels use.
That is an unusually lean profile: 1 serving of squid gives 23.4 g of protein for 138 kcal, or 16.9 g of protein per 100 calories. Fat adds 2.1 g and carbohydrate 4.6 g.
Preparation changes the number: 92–175 calories per 100 g
Raw squid has 92 kcal per 100 g and fried squid has 175 kcal per 100 g.
The gap between raw squid and fried squid is 83 calories per 100 g, mostly from fat added or absorbed during cooking. Log the version you actually eat.
Vitamin B12: 78% of the RI in 1 serving
1 serving of squid (150 g) provides 2 µg of vitamin B12, 78% of the reference intake. It also supplies 2.3 mg of zinc (23%) and 369 mg of potassium (18%). Per 100 g the vitamin B12 content is 1.3 µg.
Figures are for raw squid, as analysed by the USDA.
23.4 g of protein in 1 serving
1 serving of squid (150 g) provides 23.4 g of protein, 47% of the reference intake for protein. Per 100 g the figure is 15.6 g. Measured against energy, that is 16.9 g of protein for every 100 calories; among the meats and fish on this site, bacon has 33.9 g per 100 g.
Across common portions: 1 serving gives 23.4 g, 1 small serving gives 13.2 g and 1 large serving gives 39 g.
Every 10 g adds 9.2 calories
Squid has 0.9 calories per gram, so the portion decides the total. 1 small serving (85 g) comes to 78 kcal, while 1 large serving (250 g) reaches 230 kcal.
If you weigh your food, 100 calories of squid is about 109 g. 1 serving of squid (150 g), the portion most people look up, has 138 kcal.
Compared with similar foods
Squid next to similar meats and fish, per 100 g.
| Food | kcal | Protein | Carbs | Fat |
|---|---|---|---|---|
| Squid | 92 | 15.6 g | 3.1 g | 1.4 g |
| Haddock | 90 | 20 g | 0 g | 0.6 g |
| Crab sticks | 95 | 7.6 g | 15 g | 0.5 g |
| Lobster | 89 | 19 g | 0 g | 0.9 g |
| Tuna in water | 86 | 19.4 g | 0 g | 1 g |
| Sole | 86 | 15.2 g | 0 g | 2.4 g |
Questions people ask
How many calories are in 1 serving of squid?
1 serving of squid (150 g) has 138 kcal. 100 g has 92 kcal.
How many calories are in 100 g of squid?
100 g of raw squid has 92 kcal, with 15.6 g of protein, 3.1 g of carbohydrate and 1.4 g of fat.
How much protein is in squid?
1 serving of squid (150 g) has 23.4 g of protein. Per 100 g: 15.6 g.
Does cooking change the calories in squid?
Per 100 g: raw squid 92 and fried squid 175 calories. The difference comes from added fat or from water lost or gained.
How much salt is in squid?
1 serving of squid (150 g) has 0.2 g of salt (66 mg of sodium). Per 100 g: 0.1 g of salt.
Is squid keto-friendly?
In small amounts. 1 serving of squid (150 g) has 4.6 g of net carbs, a noticeable share of a 20–50 g daily keto limit.
Similar foods
Squid calories at a glance
Sources and method
Nutrient values: USDA FoodData Central, SR Legacy, FDC 174223, retrieved 2026-11-18. Portion weights: USDA and AUSNUT household measures or standard container sizes. Percentages use the EU/UK reference intakes. Glycemic index: International Tables (Atkinson et al., 2021). How we calculate these numbers